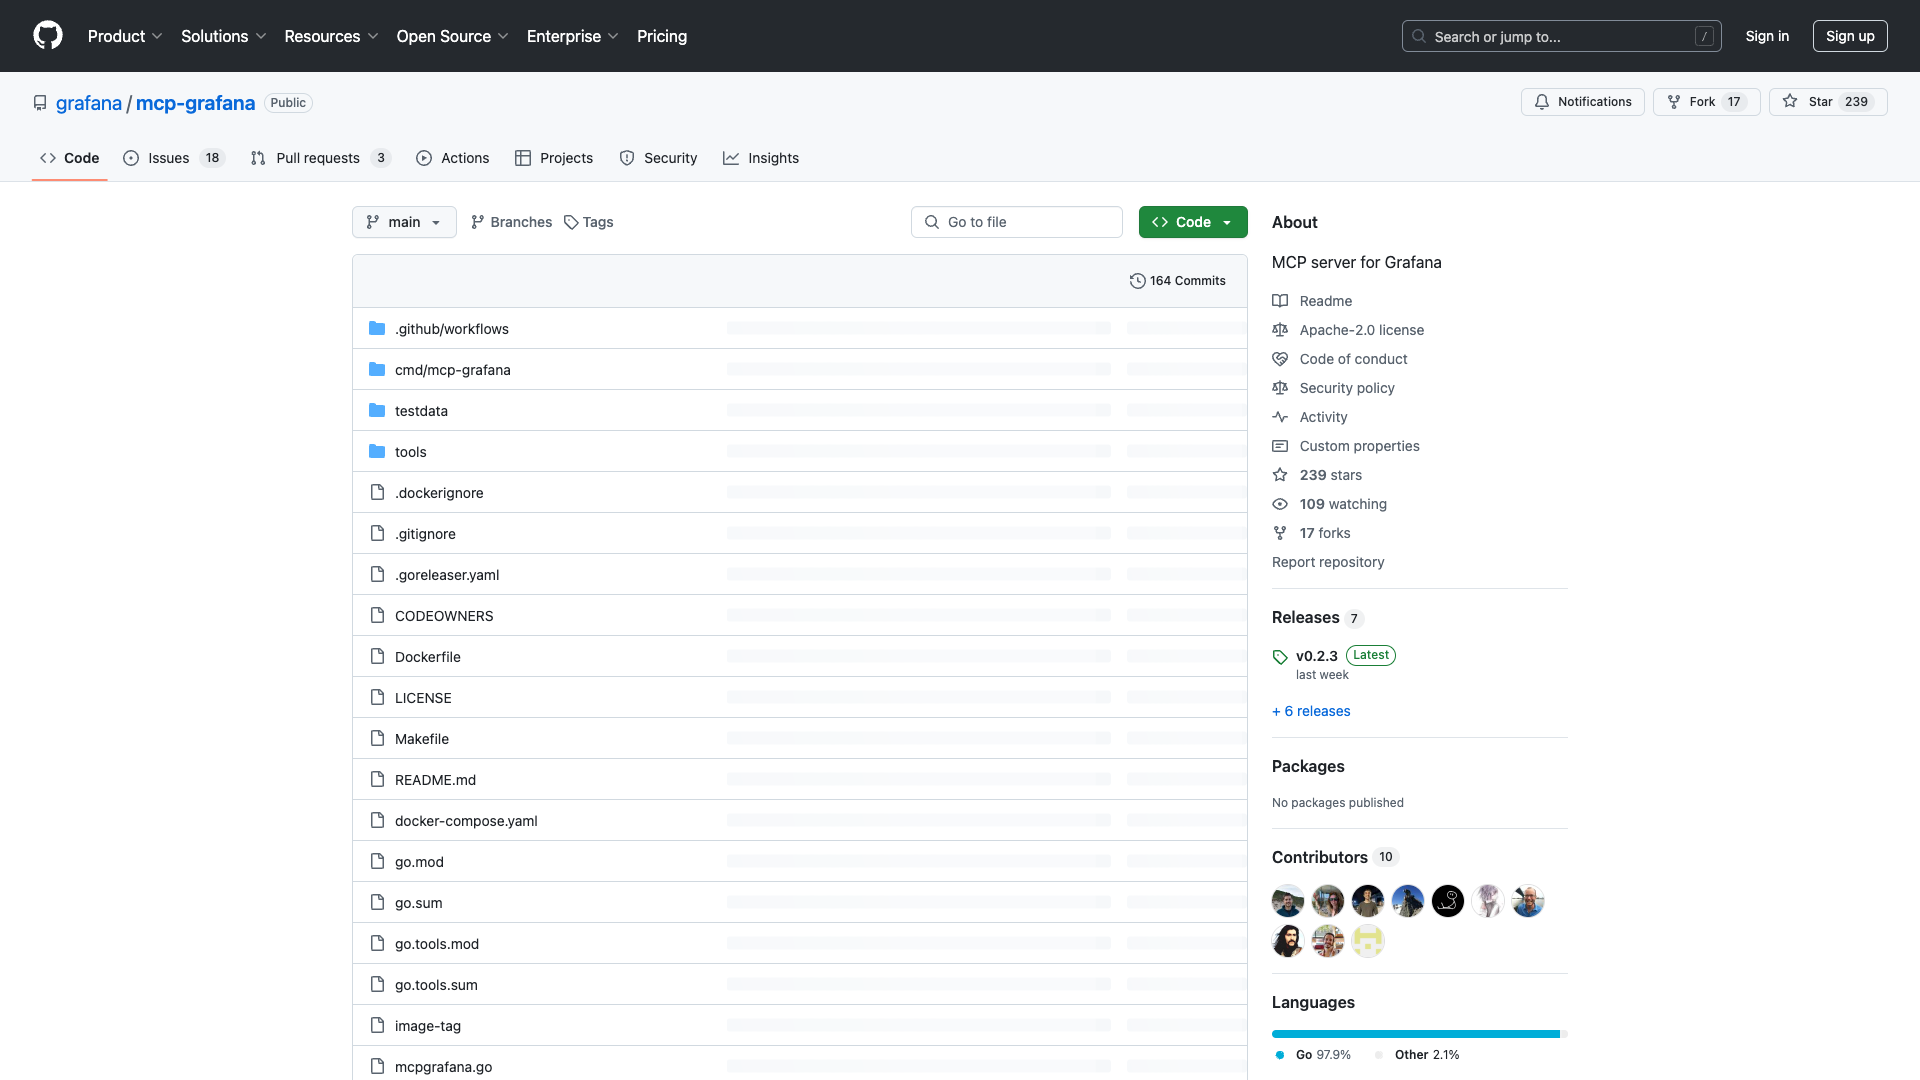
Comprehensive Review of mcp-grafana
The mcp-grafana server is an innovative Model Context Protocol (MCP) server tailored specifically for enhancing the Grafana experience. Developed by the Grafana community, this tool aims to streamline interactions with various data sources and monitoring tools within the Grafana ecosystem, making it an essential asset for software developers, DevOps engineers, and advanced technical professionals.
Key Features and Functionalities
The mcp-grafana acts as a bridge between users and their Grafana environments, offering a robust interface for accessing numerous functionalities related to dashboards, datasources, alerting mechanisms, and incident management. Here are some of its standout features:
- Dashboard Management: Effortlessly search for existing dashboards or retrieve specific ones using unique identifiers (UIDs), enhancing your ability to navigate complex visualizations quickly.
- Datasource Interaction: List detailed information about various datasources including Prometheus and Loki, allowing seamless integration into your data workflows.
- Incident Handling: Create new incidents or modify existing ones directly through the MCP server, ensuring timely responses during critical situations.
- Alert Rule Configuration: Manage alert rules efficiently by listing statuses, creating new rules, and modifying contact points all within one streamlined interface.
Installation and Setup
Setting up mcp-grafana is straightforward, but it does require some technical familiarity. Here’s a brief overview of the installation process:
- Create a service account in your Grafana instance with the necessary permissions.
- Generate a service account token from the created account.
- Download the latest release of mcp-grafana from its releases page on GitHub or build it locally if you have Go installed.
- Configure the client settings, including GRAFANA_URL and GRAFANA_API_KEY, in your configuration file.
- Ensure proper path specifications when invoking commands related to mcdgafn.
While the installation steps are clearly outlined, users without a background in Go programming may find the setup somewhat challenging. This could potentially deter less experienced users from fully leveraging the tool's capabilities.
User Experience and Usability
From a usability perspective, mcp-grafana excels in providing a clean interface for managing dashboards and datasources. Users can quickly search for dashboards or retrieve them using UIDs, significantly reducing the time spent navigating complex visualizations. The integration of detailed datasource information enhances workflow efficiency, making it easier to access metrics and logs.
However, there is room for improvement in terms of setup ease. While advanced users may navigate the installation process without issue, simplifying the initial setup could make the tool more accessible to a broader audience.
Incident Handling and Alert Configuration
The incident handling capabilities of mcp-grafana stand out as one of its strongest features. Users can create and modify incidents directly through the interface, ensuring timely responses during critical situations—an essential requirement in IT operations. Additionally, the ability to manage alert rules efficiently enhances collaboration among teams working on high-stakes projects.
Despite these robust functionalities, some users may desire additional granularity or customization options based on user roles, allowing for tailored experiences that align more closely with organizational structures.
Community Engagement and Development Quality
The development of mcp-grafana is rooted in community collaboration, which adds significant credibility to the product. Active engagement on GitHub encourages continuous enhancements and knowledge sharing, resonating with professionals who value transparency and collaboration in their tools. The open-source nature of the project under the Apache License 2.0 fosters an environment where users can contribute to improvements and report issues openly.
Conclusion: A Valuable Tool with Some Caveats
Overall, mcp-grafana provides indispensable support for enriching interactions within Grafana ecosystems, effectively addressing core expectations related to dashboard management and efficient query capabilities across multiple data sources. However, potential adopters should be aware of the initial complexity during setup, particularly if they lack a development background.
In conclusion, mcp-grafana is a tool worth adopting, especially for those looking to enhance their Grafana experience. With realistic expectations about onboarding complexity, users will find that once properly set up, it serves valuable utility in navigating increasingly intricate tech landscapes.
Open Link